So what I did was create a new series for the SBS to allow the sixteen teams to play 162 games against each other (AL vs. AL, NL vs. NL, and a set of interleague games between teams), to see which would be crowned "Best of the Rest" (or is that "Worst?")
Each of the eight teams would play 11 games against each other home and away, and 8 games against one opponent from the other league (4 home and 4 away). To review, these were the sixteen teams that were eliminated during the regular season (along with their season records that got them here in the first place):
- AL Eastern Conference Division 1 (AL Stadiums)
- 2005 (Detroit) 72-90
- 1991 (Toronto) 70-92
- AL Eastern Conference Division 2 (NL Stadiums)
- 1996 (Philadelphia) 77-85
- 1988 (Cincinnati) 71-91
- AL Western Conference Division 1 (AL Stadiums)
- 1987 (Oakland) 72-90
- 1989 (Anaheim) 70-92
- AL Western Conference Division 2 (NL Stadiums)
- 1990 (Chicago N) 68-94
- 1992 (San Diego) 60-102
- NL Eastern Conference Division 1 (AL Stadiums)
- 1993 (Baltimore) 76-86
- 1991 (Toronto) 56-106
- NL Eastern Conference Division 2 (NL Stadiums)
- 1994 (Pittsburgh) 67-95
- 1988 (Cincinnati) 62-100
- NL Western Conference Division 1 (AL Stadiums)
- 1987 (Oakland) 70-92
- 1989 (Anaheim) 62-100
- NL Western Conference Division 2 (NL Stadiums)
- 2004 (Houston) 79-83
- 1990 (Chicago N) 60-102

If you can't see the picture, here are the "Redemption" standings (compared with their regular season records):
American League:
- 88 AL ALL-STAR 100-62 (71-91, 29 game improvement)
- 96 AL ALL-STAR 95-67 (77-85, 18 game improvement)
- 05 AL ALL-STAR 84-78 (72-90, 12 game improvement)
- 92 AL ALL-STAR 83-79 (60-102, 23 game improvement)
- 91 AL ALL-STAR 77-85 (70-92, 7 game improvement)
- 87 AL ALL-STAR 73-89 (72-90, 1 game improvement)
- 89 AL ALL-STAR 73-89 (70-92, 3 game improvement)
- 90 AL ALL-STAR 71-91 (68-94, 3 game improvement)
National League:
- 04 NL ALL-STAR 103-59 (79-83, 24 game improvement)
- 94 NL ALL-STAR 92-70 (67-95, 25 game improvement)
- 90 NL ALL-STAR 88-74 (60-102, 28 game improvement)
- 93 NL ALL-STAR 86-76 (76-86, 10 game improvement)
- 87 NL ALL-STAR 83-79 (70-92, 13 game improvement)
- 89 NL ALL-STAR 65-97 (62-100, 3 game improvement)
- 88 NL ALL-STAR 64-98 (62-100, 2 game improvement)
- 91 NL ALL-STAR 59-103 (56-106, 3 game improvement)
The 1987 and 1989 AL All-Star Teams shared the same 73-89 record, sixth best in the AL. However, after reviewing the game logs of the 22 games these two teams played head-to-head, the 1987 team won the season series over the 1989 team 13 games to 9.
Overall, all 16 teams had better records facing each other than when they faced their regular competition. If there is one thing I have to point out, it's that the 1991 NL All-Star Team is probably the worst among the 50 (including the 2011 rosters that are not participating in the tournament) I created, even with the addition of two extra relievers. If I remember correctly, when my 1991 All-Star teams faced each other, not only did the 1991 AL All-Stars dominate the seven 10,000 game simulations (the only team to sweep their opponent), but in the one-game All-Star Game, the AL shut out the NL 2-0.
The reason why I had them play a full season of games was so that I could seed each team into the Redemption Tournament. For each league, the 1st seed will take on the 8th seed, 2nd seed vs.7th seed, the 3rd seed plays the 6th seed, and the 4th seed plays the 5th seed. The teams will compete in a best-of-seven series of 10,000 games, the winners move on until there is one AL and one NL team left standing. Those two teams will compete for the right to be called the "All-Star Redeem Team."
So based on the standings, here is the bracket for the Redemption All-Star Tournament:
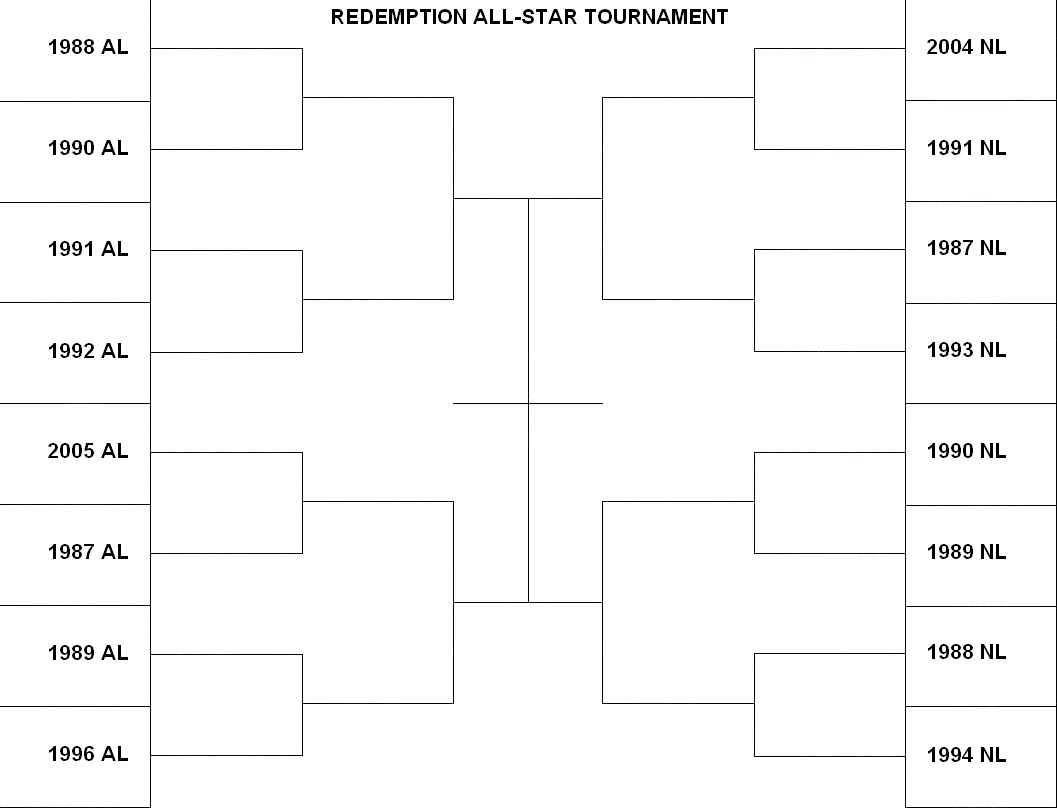
For those who can't see the picture, the redemption tournament brackets are:
American League:
(1) 1988 AL vs. (8) 1990 AL
(4) 1992 AL vs. (5) 1991 AL
(3) 2005 AL vs. (6) 1987 AL
(2) 1996 AL vs. (7) 1989 AL
National League:
(1) 2004 NL vs. (8) 1991 NL
(4) 1993 NL vs. (5) 1987 NL
(3) 1990 NL vs. (6) 1989 NL
(2) 1994 NL vs. (7) 1988 NL
If anything, it keeps the teams active while the other 32 play in the real tournament.
Sincerely,
JayBee Anama
No comments:
Post a Comment