Thursday, September 27, 2012

AL Eastern Conference Round 1: (2) 1997 AL vs. (3) 2008 AL

The 1997 AL All-Star Team vs. The 2008 AL All-Star Team

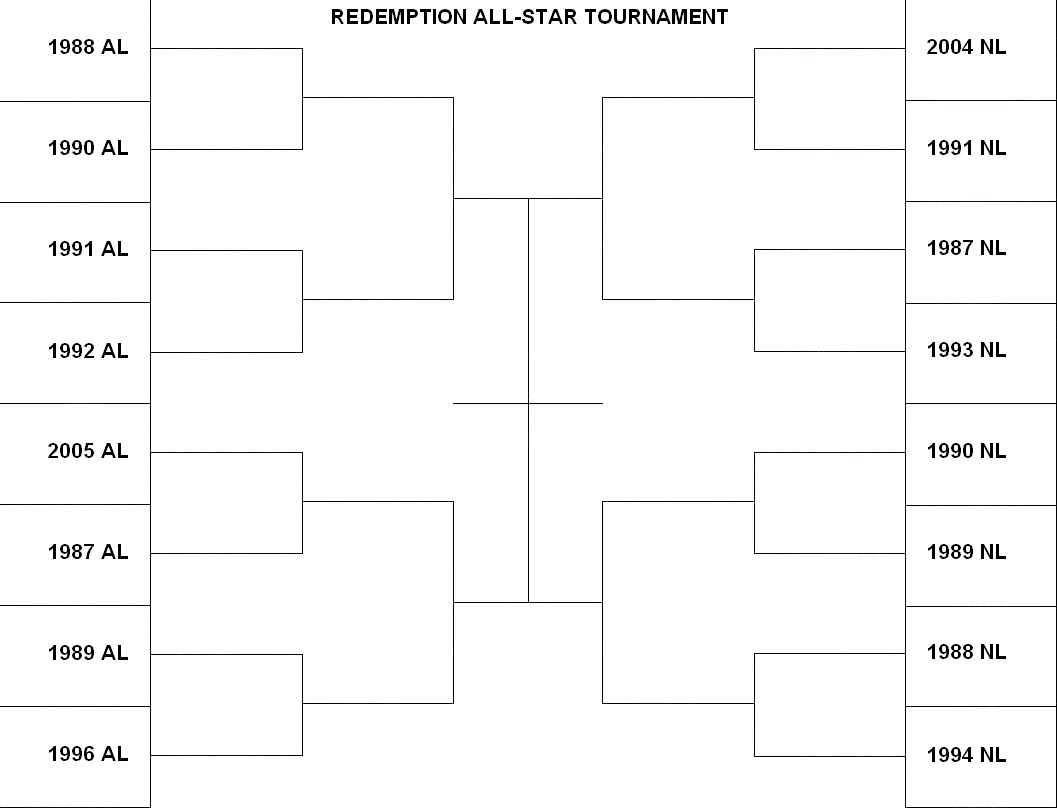
The second AL Eastern Conference Round 1 match pitted the second seed 1997 AL All-Star Team against the 3rd seed 2008 AL All-Star Team. To review, here are how the pitching match-ups and lineups were determined:
  • The pitching rotations were set based on the All-Star Series results posted on bdj610's Topps Baseball Card Blog (you can click on each of the links on the sidebar to see each year's match-ups).
  • The lineups for the first six series were set, with each position player in the starting lineup twice.
  • The seventh series was done in an anything goes format, where the lineups were randomly determined, spot starters were used (SBS only allows up to five names for the rotation).
  • The series was not run in a best-of-seven (first to four wins). All seven series are run regardless of the outcome.
So let's begin with the season summary for both teams.

The 1997 AL All-Stars finished second in their division with a 91-71 record. The 2008 AL All-Stars finished third with a 75-87 record.  The 1997 AL All-Stars took the season series against the 2008 AL All-Stars 10-8.

For the tournament, each series consists of 10,000 simulated games. The winner of each series = the winner of a game. Here are the results from the seven series simulations:

  • Game 1: 2008 AL vs. 1997 AL, Cliff Lee (08) vs. Roger Clemens (97). The 97 AL team wins 6,217 games out of 10,000 simulations.
  • Game 2: 2008 AL vs. 1997 AL, Roy Halladay (08) vs. Brad Radke (97). The 97 AL team wins 5,004 games. The 2008 AL team had the lead most of the series, but the 97 AL team overtook them in the final 500 games.
  • Game 3: 1997 AL vs. 2008 AL, Andy Pettitte (97) vs. Daisuke Matsuzaka (08). The 97 AL team wins 5,942 games.
  • Game 4: 1997 AL vs. 2008 AL, Randy Johnson (97) vs. Gavin Floyd (08).  The 97 AL team wins 7,015 games.
  • Game 5: 1997 AL vs. 2008 AL, Jamie Moyer (97) vs. Joe Saunders (08). The 97 AL team wins 5,412 games.
  • Game 6: 2008 AL vs. 1997 AL, A. J. Burnett (08) vs. Pat Hentgen (93).  The 97 AL team wins 5,728 games.
  • Game 7: 2008 AL vs. 1997 AL, anything goes. The 1997 AL team wins 6,103 games.

The 1997 AL All-Star Team advances to the second round thanks to a 7-0 series sweep. They will face the 1999 AL All-Star Team in the second round in a (1) vs. (2) seed match-up.

Sincerely,

JayBee Anama

AL Eastern Conference Round 1: (1) 1999 AL vs. (4) 1993 AL

In figuring out how best to post the results for each series, it has taken me a while to get the results for each postseason series onto the blog. I think I have it figured out though. Bear with me as it's a first attempt.

The 1999 AL All-Star Team vs. The 1993 AL All-Star Team

The first AL Eastern Conference Round 1 match pitted the first seed 1999 AL All-Star Team against the 4th seed 1993 AL All-Star Team. Here are how the pitching match-ups and lineups were determined:

  • The pitching rotations were set based on the All-Star Series results posted on bdj610's Topps Baseball Card Blog (you can click on each of the links on the sidebar to see each year's match-ups).
  • The lineups for the first six series were set, with each position player in the starting lineup twice.
  • The seventh series was done in an anything goes format, where the lineups were randomly determined, spot starters were used (SBS only allows up to five names for the rotation).
  • The series was not run in a best-of-seven (first to four wins). All seven series are run regardless of the outcome.

So let's begin with the season summary for both teams.

The 1999 AL All-Stars won their division with a 98-64 record. The 1993 AL All-Stars finished fourth with a 72-90 record, and won the tie breaker with the 2005 AL All-Star team thanks to a 10-8 head-to-head season series.  The 1999 AL All-Stars took the season series against the 1993 AL All-Stars 13-5.

For the tournament, each series consists of 10,000 simulated games. The winner of each series = the winner of a game. Here are the results from the seven series simulations:

  • Game 1: 1993 AL vs. 1999 AL, Jack McDowell (93) vs. Pedro Martinez (99). The 99 AL team wins 8,090 games out of 10,000 simulations.
  • Game 2: 1993 AL vs. 1999 AL, Randy Johnson (93) vs. Bartolo Colon (99). The 99 AL team wins 5,337 games.
  • Game 3: 1999 AL vs. 1993 AL, Mike Mussina (99) vs. Kevin Appier (93). The 93 AL team wins 5,393 games.
  • Game 4: 1999 AL vs. 1993 AL, Aaron Sele (99) vs. Jimmy Key (93). The 93 AL team wins 5,180 games.
  • Game 5: 1999 AL vs. 1993 AL, Orlando Hernandez (99) vs. Pat Hentgen (93). The 99 AL team wins 7,050 games.
  • Game 6: 1993 AL vs. 1999 AL, Mark Langston (93) vs. David Wells (99). The 99 AL team wins 5,429 games.
  • Game 7: 1993 AL vs. 1999 AL, anything goes. The 1999 AL team wins 5,889 games.

The 1999 AL All-Star Team advances to the second round thanks to a 5-2 series win. They will face the winner of the (2) 1997 AL All-Star Team vs. (3) 2008 AL All-Star team. The results for this series will be posted shortly.

Sincerely,

JayBee Anama

Friday, September 21, 2012

Redemption Tournament

For the sixteen teams that finished in fifth or sixth place, I thought it would be nice to give them a second chance. You know, with that much star power on the roster, the team as a whole can't really be that bad...can they?

So what I did was create a new series for the SBS to allow the sixteen teams to play 162 games against each other (AL vs. AL, NL vs. NL, and a set of interleague games between teams), to see which would be crowned "Best of the Rest" (or is that "Worst?")

Each of the eight teams would play 11 games against each other home and away, and 8 games against one opponent from the other league (4 home and 4 away). To review, these were the sixteen teams that were eliminated during the regular season (along with their season records that got them here in the first place):

  • AL Eastern Conference Division 1 (AL Stadiums)
  1. 2005 (Detroit) 72-90
  2. 1991 (Toronto) 70-92
  • AL Eastern Conference Division 2 (NL Stadiums)
  1. 1996 (Philadelphia) 77-85
  2. 1988 (Cincinnati) 71-91
  • AL Western Conference Division 1 (AL Stadiums)
  1. 1987 (Oakland) 72-90
  2. 1989 (Anaheim) 70-92
  • AL Western Conference Division 2 (NL Stadiums)
  1. 1990 (Chicago N) 68-94
  2. 1992 (San Diego) 60-102
  • NL Eastern Conference Division 1 (AL Stadiums)
  1. 1993 (Baltimore) 76-86
  2. 1991 (Toronto) 56-106
  • NL Eastern Conference Division 2 (NL Stadiums)
  1. 1994 (Pittsburgh) 67-95
  2. 1988 (Cincinnati) 62-100
  • NL Western Conference Division 1 (AL Stadiums)
  1. 1987 (Oakland) 70-92
  2. 1989 (Anaheim) 62-100
  • NL Western Conference Division 2 (NL Stadiums)
  1. 2004 (Houston) 79-83
  2. 1990 (Chicago N) 60-102
Here are the results of the "Redemption Season"


If you can't see the picture, here are the "Redemption" standings (compared with their regular season records):

American League:
  • 88 AL ALL-STAR 100-62 (71-91, 29 game improvement)
  • 96 AL ALL-STAR 95-67 (77-85, 18 game improvement)
  • 05 AL ALL-STAR 84-78 (72-90, 12 game improvement)
  • 92 AL ALL-STAR 83-79 (60-102, 23 game improvement)
  • 91 AL ALL-STAR 77-85 (70-92, 7 game improvement)
  • 87 AL ALL-STAR 73-89 (72-90, 1 game improvement)
  • 89 AL ALL-STAR 73-89 (70-92, 3 game improvement)
  • 90 AL ALL-STAR 71-91 (68-94, 3 game improvement)
National League:
  • 04 NL ALL-STAR 103-59 (79-83, 24 game improvement)
  • 94 NL ALL-STAR 92-70 (67-95, 25 game improvement)
  • 90 NL ALL-STAR 88-74 (60-102, 28 game improvement)
  • 93 NL ALL-STAR 86-76 (76-86, 10 game improvement)
  • 87 NL ALL-STAR 83-79 (70-92, 13 game improvement)
  • 89 NL ALL-STAR 65-97 (62-100, 3 game improvement)
  • 88 NL ALL-STAR 64-98 (62-100, 2 game improvement)
  • 91 NL ALL-STAR 59-103 (56-106, 3 game improvement)
The 1987 and 1989 AL All-Star Teams shared the same 73-89 record, sixth best in the AL. However, after reviewing the game logs of the 22 games these two teams played head-to-head, the 1987 team won the season series over the 1989 team 13 games to 9.

Overall, all 16 teams had better records facing each other than when they faced their regular competition.  If there is one thing I have to point out, it's that the 1991 NL All-Star Team is probably the worst among the 50 (including the 2011 rosters that are not participating in the tournament) I created, even with the addition of two extra relievers.  If I remember correctly, when my 1991 All-Star teams faced each other, not only did the 1991 AL All-Stars dominate the seven 10,000 game simulations (the only team to sweep their opponent), but in the one-game All-Star Game, the AL shut out the NL 2-0.

The reason why I had them play a full season of games was so that I could seed each team into the Redemption Tournament.  For each league, the 1st seed will take on the 8th seed, 2nd seed vs.7th seed, the 3rd seed plays the 6th seed, and the 4th seed plays the 5th seed.  The teams will compete in a best-of-seven series of 10,000 games, the winners move on until there is one AL and one NL team left standing.  Those two teams will compete for the right to be called the "All-Star Redeem Team."  

So based on the standings, here is the bracket for the Redemption All-Star Tournament:


For those who can't see the picture, the redemption tournament brackets are:

American League:
(1) 1988 AL vs. (8) 1990 AL
(4) 1992 AL vs. (5) 1991 AL
(3) 2005 AL vs. (6) 1987 AL
(2) 1996 AL vs. (7) 1989 AL

National League:
(1) 2004 NL vs. (8) 1991 NL
(4) 1993 NL vs. (5) 1987 NL
(3) 1990 NL vs. (6) 1989 NL
(2) 1994 NL vs. (7) 1988 NL

If anything, it keeps the teams active while the other 32 play in the real tournament.  

Sincerely,

JayBee Anama

Here Are the Brackets!

The brackets are now set and the 32-team tournament will begin in earnest (Saturday, September 22). Each series will have it's own post, and if I can pull it off, there will be two a day for this first round. Below are the brackets. First for the American League:


For those who can't see the picture, the AL brackets are:

Eastern Conference Division 1
(1) 1999 AL vs. (4) 1993 AL
(2) 1997 AL vs. (3) 2008 AL

Eastern Conference Division 2
(1) 1994 AL vs. (4) 2002 AL
(2) 2006 AL vs. (3) 2000 AL

Western Conference Division 1
(1) 2003 AL vs. (4) 2010 AL
(2) 1995 AL vs. (3) 2001 AL

Western Conference Division 2
(1) 2009 AL vs. (4) 2007 AL
(2) 1998 AL vs. (3) 2004 AL

Now the National League:


For those who can't see the picture, the NL brackets are:

Eastern Conference Division 1
(1) 1999 NL vs. (4) 1997 NL
(2) 2005 NL vs. (3) 2008 NL

Eastern Conference Division 2
(1) 2002 NL vs. (4) 2006 NL
(2) 2000 NL vs. (3) 1996 NL

Western Conference Division 1
(1) 2003 NL vs. (4) 1995 NL
(2) 2001 NL vs. (3) 2010 NL

Western Conference Division 2
(1) 1998 NL vs. (4) 2009 NL
(2) 2007 NL vs. (3) 1992 NL

On Saturday, the results for the simulations of the AL Eastern Conference will be posted.

Sincerely,

JayBee Anama

Thursday, September 20, 2012

National League Western Conference Season in Review

The results are in and today, we will review the seasons of the twelve All-Star Teams that comprised of the National League Western Conference.

The twelve teams that make up this conference were split into two divisions (click on the links to see the cards and players of each of the teams):
  • Western Conference Division 1 (AL Stadiums)
  1. 1987 (Oakland)
  2. 1989 (Anaheim)
  3. 1995 (Texas)
  4. 2001 (Seattle)
  5. 2003 (Chicago A)
  6. 2010 (Anaheim)
  • Western Conference Division 2 (NL Stadiums)
  1. 1990 (Chicago N)
  2. 1992 (San Diego)
  3. 1998 (Colorado)
  4. 2004 (Houston)
  5. 2007 (San Francisco)
  6. 2009 (St. Louis)
Here are the results of the simulated 162-game season:


If you can't see the picture, here are the standings:

Western Conference Division 1
  • 03 NL ALL-STAR 101-61
  • 01 NL ALL-STAR 94-68
  • 10 NL ALL-STAR 84-78
  • 95 NL ALL-STAR 78-84
  • 87 NL ALL-STAR 70-92
  • 89 NL ALL-STAR 62-100

2003 NL All-Stars - NL Western Conference Division 1 Winner

Western Conference Division 2
  • 98 NL ALL-STAR 93-69
  • 07 NL ALL-STAR 86-76
  • 92 NL ALL-STAR 83-79
  • 09 NL ALL-STAR 82-80
  • 04 NL ALL-STAR 79-83
  • 90 NL ALL-STAR 60-102

1998 NL All-Stars - NL Western Conference Division 2 Winner

Some of the season highlights:

Teammates Rich Aurelia and Chipper Jones (2001 NL) both hit for the cycle (Aurelia against the 2007 NL All-Stars; Jones against the 1992 NL All-Stars).


Team stats:

The 1998 NL All-Stars led the NL West Conference in batting average (.283), RBI's (862, Devon White with 72), and OPS (.812). The 2001 NL All-Stars led in home runs (233, Barry Bonds with 28), while the 1992 team led in stolen bases (194, Marquis Grissom with 40).

The 2003 NL All-Stars won the conference regular season title with its 101-61 record. The team also led the Conference in saves with 52. The 2010 NL All-Stars team led in team ERA with a "low" 3.49. The 2001 NL All-Stars and 2004 NL All-Stars shared the conference lead in complete games with 22 each, while the 2001 NL All-Stars and 2007 NL All-Stars tied for most shutouts with 9 a piece.

The 1992 NL All-Stars led the conference in fielding percentage (a low 75 errors, .988 fielding percentage).

The top four teams in each division will advance to the 32-team tournament, meaning eight teams will advance to the postseason. Each round of this postseason will consist of 10,000 simulated games, and each series will have it's own post (akin to the simulations I held on my humble, little blog). Each first place team will take on the fourth place team within its division, and each second place team will take on the third place team. So the first eight series will consist of the following teams:

Western Conference Division 1
(1) 2003 NL vs. (4) 1995 NL
(2) 2001 NL vs. (3) 2010 NL

Western Conference Division 2
(1) 1998 NL vs. (4) 2009 NL
(2) 2007 NL vs. (3) 1992 NL

Congratulations to the advancing teams. On Friday, the final tournament bracket with all 32 playoff-bound teams will be up, as well as a quick tournament for the 16 teams for the eliminated teams.

Sincerely,

JayBee Anama

Wednesday, September 19, 2012

National League Eastern Conference Season in Review

The results are in and today, we will review the seasons of the twelve All-Star Teams that comprised of the National League Eastern Conference.

The twelve teams that make up this conference were split into two divisions (click on the links to see the cards and players of each of the teams):
  • Eastern Conference Division 1 (AL Stadiums)
  1. 1991 (Toronto)
  2. 1993 (Baltimore)
  3. 1997 (Cleveland)
  4. 1999 (Boston)
  5. 2005 (Detroit)
  6. 2008 (New York A)
  • Eastern Conference Division 2 (NL Stadiums)
  1. 1988 (Cincinnati)
  2. 1994 (Pittsburgh)
  3. 1996 (Philadelphia)
  4. 2000 (Atlanta)
  5. 2002 (Milwaukee)
  6. 2006 (Pittsburgh)
Here are the results of the simulated 162-game season:


If you can't see the picture, here are the standings:

Eastern Conference Division 1
  • 99 NL ALL-STAR 98-64
  • 05 NL ALL-STAR 91-71
  • 08 NL ALL-STAR 84-78
  • 97 NL ALL-STAR 83-79
  • 93 NL ALL-STAR 76-86
  • 91 NL ALL-STAR 56-106

1999 NL All-Stars - NL Eastern Conference Division 1 Winner 


Eastern Conference Division 2
  • 02 NL ALL-STAR 97-65
  • 00 NL ALL-STAR 92-70
  • 96 NL ALL-STAR 85-77
  • 06 NL ALL-STAR 81-81
  • 94 NL ALL-STAR 67-95
  • 88 NL ALL-STAR 62-100

2002 NL All-Stars - NL Eastern Conference Division 2 Winner 

Team stats:

The 1999 NL All-Stars led the NL East Conference in batting average (.277), home runs (250, Mark McGwire with 30) RBI's (845, McGwire with 69), OPS (.818). The 1988 team led in stolen bases (168, Andy Van Slyke with 24).

The 1999 NL All-Stars, led by Kevin Millwood (19-7, 3.32 ERA), won the conference regular season title with its 98-64 record (which coincidentally, the 1999 AL All-Stars finished their season with the same record). The 2002 and 2008 NL All-Stars teams tied for the conference lead in saves with 51. The 1997 team led in team ERA with a "low" 3.78 and shutouts with 10. The 1991 NL All-Stars led the conference with 32 complete games.

The 2008 NL All-Stars led the conference in fielding percentage (a low 86 errors, .986 fielding percentage).

The top four teams in each division will advance to the 32-team tournament, meaning eight teams will advance to the postseason. Each round of this postseason will consist of 10,000 simulated games, and each series will have it's own post (akin to the simulations I held on my humble, little blog). Each first place team will take on the fourth place team within its division, and each second place team will take on the third place team. So the first eight series will consist of the following teams:

Eastern Conference Division 1
(1) 1999 NL vs. (4) 1997 NL
(2) 2005 NL vs. (3) 2008 NL

Eastern Conference Division 2
(1) 2002 NL vs. (4) 2006 NL
(2) 2000 NL vs. (3) 1996 NL

Congratulations to the advancing teams. On Thursday, the National League Western Conference season in review.

Sincerely,

JayBee Anama

Tuesday, September 18, 2012

American League Western Conference Season in Review

The results are in and today, we will review the seasons of the twelve All-Star Teams that comprised of the American League Western Conference.

The twelve teams that make up this conference were split into two divisions (click on the links to see the cards and players of each of the teams):
  • Western Conference Division 1 (AL Stadiums)
  1. 1987 (Oakland)
  2. 1989 (Anaheim)
  3. 1995 (Texas)
  4. 2001 (Seattle)
  5. 2003 (Chicago A)
  6. 2010 (Anaheim)
  • Western Conference Division 2 (NL Stadiums)
  1. 1990 (Chicago N)
  2. 1992 (San Diego)
  3. 1998 (Colorado)
  4. 2004 (Houston)
  5. 2007 (San Francisco)
  6. 2009 (St. Louis)
Here are the results of the simulated 162-game season:


If you can't see the picture, here are the standings:

Western Conference Division 1
  • 03 AL ALL-STAR 99-63
  • 95 AL ALL-STAR 95-67
  • 01 AL ALL-STAR 87-75
  • 10 AL ALL-STAR 87-75
  • 87 AL ALL-STAR 72-90
  • 89 AL ALL-STAR 70-92

2003 AL All-Stars - AL Western Conference Division 1 Winner 

Western Conference Division 2
  • 09 AL ALL-STAR 86-76
  • 98 AL ALL-STAR 85-77
  • 04 AL ALL-STAR 83-79
  • 07 AL ALL-STAR 80-82
  • 90 AL ALL-STAR 68-94
  • 92 AL ALL-STAR 60-102

2009 AL All-Stars - AL Western Conference Division 2 Winner 

The 2001 and 2010 AL All-Star Teams shared the same 87-75 record, third best in Division 1. However, both teams split the 18 games they played against each other (with each team going 6-3 on the road).  So, to determine who gets the higher seeding, the number of wins against the rest of the division were researched.  After reviewing the game logs of the 144 games the two teams played against the other four teams in their division, it looks like the 2001 All-Stars went 39-33 against the rest of the division, which beats the 35-37 divisional record of the 2010 team.

Team stats:

The 1995 AL All-Stars led the AL Western Conference in batting average (.281), RBI's (900, Albert Belle with 145), OPS (.817). The 2001 AL All-Stars led in home runs (241, Mike Sweeney with 20), while the 2009 team led in stolen bases (158, Carl Crawford with 36).

The 2003 AL All-Stars won the conference regular season title with its 99-63 record. The team also led the Conference in saves with 58. The 2010 AL All-Stars team led in team ERA with a "low" 3.71. The 1987 AL All-Stars led the conference with an astounding 86 complete games while the 1995 team led in shutouts with 12 shutouts.

The 1998 AL All-Stars led the conference in fielding percentage (a low 84 errors, .986 fielding percentage).

The top four teams in each division will advance to the 32-team tournament, meaning eight teams will advance to the postseason. Each round of this postseason will consist of 10,000 simulated games, and each series will have it's own post (akin to the simulations I held on my humble, little blog). Each first place team will take on the fourth place team within its division, and each second place team will take on the third place team. So the first eight series will consist of the following teams:

Western Conference Division 1
(1) 2003 AL vs. (4) 2010 AL
(2) 1995 AL vs. (3) 2001 AL

Western Conference Division 2
(1) 2009 AL vs. (4) 2007 AL
(2) 1998 AL vs. (3) 2004 AL

Congratulations to the advancing teams. On Wednesday, the National League Eastern Conference season in review.

Sincerely,

JayBee Anama

Monday, September 17, 2012

American League Eastern Conference Season in Review

The results are in and today, we will review the seasons of the twelve All-Star Teams that comprised of the American League Eastern Conference.

The twelve teams that make up this conference were split into two divisions (click on the links to see the cards and players of each of the teams):
  • Eastern Conference Division 1 (AL Stadiums)
  1. 1991 (Toronto)
  2. 1993 (Baltimore)
  3. 1997 (Cleveland)
  4. 1999 (Boston)
  5. 2005 (Detroit)
  6. 2008 (New York A)
  • Eastern Conference Division 2 (NL Stadiums)
  1. 1988 (Cincinnati)
  2. 1994 (Pittsburgh)
  3. 1996 (Philadelphia)
  4. 2000 (Atlanta)
  5. 2002 (Milwaukee)
  6. 2006 (Pittsburgh)
Here are the results of the simulated 162-game season:


If you can't see the picture, here are the standings:

Eastern Conference Division 1
  • 99 AL ALL-STAR 98-64
  • 97 AL ALL-STAR 91-71
  • 08 AL ALL-STAR 75-87
  • 93 AL ALL-STAR 72-90
  • 05 AL ALL-STAR 72-90
  • 91 AL ALL-STAR 70-92

1999 AL All-Stars - AL Eastern Conference Division 1 Winner

Eastern Conference Division 2
  • 94 AL ALL-STAR 93-69
  • 06 AL ALL-STAR 88-74
  • 00 AL ALL-STAR 84-78
  • 02 AL ALL-STAR 81-81
  • 96 AL ALL-STAR 77-85
  • 88 AL ALL-STAR 71-91

1994 AL All-Stars - AL Eastern Conference Division 2 Winner

The 1993 and 2005 AL All-Star Teams shared the same 72-90 record, fourth best in Division 1. However, after reviewing the game logs of the 18 games these two teams played head-to-head, the 1993 team won the season series over the 2005 team 10 games to 8.

Some of the season highlights:

Scott Erickson (1991 AL) pitching a no-hitter against the 2002 AL All-Star Team (9 strikeouts, 2 walks).


Team stats:

The 1999 AL All-Stars led the AL East Conference in batting average (.283), RBI's (868, Ken Griffey, Jr. with 67), and OPS (.806). The 2000 AL All-Stars led in home runs (229, Tony Batista with 24), while the 1991 team led in stolen bases (138, Roberto Alomar with 31).

The 1999 AL All-Stars, led by Pedro Martinez (21-2, 2.11 ERA), won the conference regular season title with its 98-64 record. The 1997 AL All-Stars led the Conference in saves with 51. The team also led in team ERA with a "low" 3.82. The 1994 AL All-Stars led the conference with 50 complete games and 10 shutouts.

The 1991 AL All-Stars led the conference in fielding percentage (a low 91 errors, .985 fielding percentage).

The top four teams in each division will advance to the 32-team tournament, meaning eight teams will advance to the postseason. Each round of this postseason will consist of 10,000 simulated games, and each series will have it's own post (akin to the simulations I held on my humble, little blog). Each first place team will take on the fourth place team within its division, and each second place team will take on the third place team. So the first eight series will consist of the following teams:

Eastern Conference Division 1
(1) 1999 AL vs. (4) 1993 AL
(2) 1997 AL vs. (3) 2008 AL

Eastern Conference Division 2
(1) 1994 AL vs. (4) 2002 AL
(2) 2006 AL vs. (3) 2000 AL

Congratulations to the advancing teams. On Tuesday, the American League Western Conference season in review.

Sincerely,

JayBee Anama

It's Time to Play the Games!!!


This will be the last time I discuss my unemployment on any of my blogs.  It is time to look forward, not back.  I enjoyed my time there, but it is time to move on.

With that said, I finally have all the divisions set on my .dat files, I have the stadiums set so that each pair of teams have a different home field.  It is time to play the games.

Earlier this year, I introduced all the teams that will participate.  My last post discussed how each series will play out.  Starting today, the 162-game seasons will begin. Each of the four conferences will have their own post featuring standings and highlights...a season in review if you will.  The top four teams in each division will advance to the playoffs.

So get out the popcorn folks.  One team will reign supreme.  Who will it be?  We will soon find out.

Sincerely,

JayBee Anama

Monday, July 9, 2012

Now That the Teams Have Been Introduced, It's Time to Play the Games!!!

Who knew that so many of the players I chose for these All-Star Teams didn't have cards???  

Sorry it took a bit longer than I liked, and it did keep me away from other important matters (like updating the Sports Card Blogroll for example).  But it is finally done.  All 50 teams, and all 650 players, and all 1762 roster spots, have now been accounted for by the means of Topps baseball cards (and honestly, would there have been any other way to put these displays together???)

So now it is on to the matter of how the tournament will commence.  All teams (with the exception of the 2011 teams, 48 in all) will participate.  There will be two leagues (an American League, and a National League, of course) consisting of 24 teams each.  Each league will consist of two twelve-team conferences, and each conference will consist of two six-team divisions.  Confused yet?  Here is the breakdown per League:

  • League - 24 teams, 2 conferences
  • Conference - 12 teams, 2 divisions
  • Division - Six teams
The home stadiums for each team will be the site of that year's All-Star Game.  Regardless of what league the team plays for (NL or AL), depending on what year they represent, they will play their home games at that stadium.  

The stadiums for both NL and AL teams:
  • 1987 - Oakland, Oakland-Alemada County Coliseum
  • 1988 - Cincinnati, Riverfront Stadium
  • 1989 - Anaheim, Anaheim Stadium
  • 1990 - Chicago N, Wrigley Field
  • 1991 - Toronto, Skydome
  • 1992 - San Diego, Jack Murphy Stadium
  • 1993 - Baltimore, Orioles Park at Camden Yards
  • 1994 - Pittsburgh, Three Rivers Stadium
  • 1995 - Texas, The Ballpark in Arlington
  • 1996 - Philadelphia, Veterans Stadium
  • 1997 - Cleveland, Jacobs Field
  • 1998 - Colorado, Coors Field
  • 1999 - Boston, Fenway Park
  • 2000 - Atlanta, Turner Field
  • 2001 - Seattle, Safeco Field
  • 2002 - Milwaukee, Miller Park
  • 2003 - Chicago A, U. S. Cellular Field
  • 2004 - Houston, Minute Maid Park
  • 2005 - Detroit, Comerica Park
  • 2006 - Pittsburgh, PNC Park
  • 2007 - San Francisco, AT&T Park
  • 2008 - New York A, Yankee Stadium
  • 2009 - St. Louis, Busch Stadium
  • 2010 - Anaheim, Angel Stadium of Anaheim
(For the record, when I add the 2011 teams later on...and they will get a chance to compete later, the home field for both teams will be Arizona's Chase Field).

So yes, there will be NL cities hosting AL games, and AL cities hosting NL games.  That's just how it's going to have to work.  The AL will be playing with designated hitters, the NL will have the pitchers bat, just like the leagues play now.  

Each league will be split into two conferences:  Eastern and Western.  The teams will be set based on where their "home fields" are located.  The divisions are determined by whether the "host" team's stadium is an NL or AL team.  The divisions for both leagues are as follows:
  • Eastern Conference Division 1 (AL Stadiums)
  1. 1991 (Toronto)
  2. 1993 (Baltimore)
  3. 1997 (Cleveland)
  4. 1999 (Boston)
  5. 2005 (Detroit)
  6. 2008 (New York A)
  • Eastern Conference Division 2 (NL Stadiums)
  1. 1988 (Cincinnati)
  2. 1994 (Pittsburgh)
  3. 1996 (Philadelphia)
  4. 2000 (Atlanta)
  5. 2002 (Milwaukee)
  6. 2006 (Pittsburgh)
  • Western Conference Division 1 (AL Stadiums)
  1. 1987 (Oakland)
  2. 1989 (Anaheim)
  3. 1995 (Texas)
  4. 2001 (Seattle)
  5. 2003 (Chicago A)
  6. 2010 (Anaheim)
  • Western Conference Division 2 (NL Stadiums)
  1. 1990 (Chicago N)
  2. 1992 (San Diego)
  3. 1998 (Colorado)
  4. 2004 (Houston)
  5. 2007 (San Francisco)
  6. 2009 (St. Louis)
Each team in the respective conferences will play each other in a unbalanced schedule of 162 simulated games (like a regular season) thanks to the SBS (Strategic Baseball Simulator).  Each team will play 18 games (9 home, 9 away, 90 games) against teams in their own division, and 12 games (6 home, 6 away, 72 games) against teams in their conference (Eastern vs. Eastern; Western vs. Western).  After the season is done, the top four teams in each division (32 teams total, 16 from each league) will advance to the playoffs.

The playoffs will be comprised of a best-of-seven 10,000 simulated games (just like the All-Star Games I played on my regular blog of which you can see the results on the sidebar).  It will be a 1 vs. 4, 2 vs. 3 format by division.  The winners of the divisions will face each other in the Conference finals.  The winners of the Conference finals will then duke it out in a League finals.  There will be one AL winner and one NL winner by the time this all plays out.  

Whichever team survives their League's championship will then face each other in a final seven series (not best of seven) 10,000 simulated games "World Championship All-Star Game" (can't say World Series).  Regardless of who wins the the seven series, there will be one All-Star Game simulation to determine a final champion.

The season starts after the All-Star Game.  It gives me time to get all the stadiums and divisions attached to each team's data file.  I've been looking forward to doing this for quite some time now.  I've been running a few tests, but nothing official.  I can tell you that every team has somehow found a way to get to the playoffs.  So it should be interesting.

Sincerely,

JayBee Anama

Sunday, July 8, 2012

2011 National League All-Star Team


First Basemen
  • Prince Fielder, Brewers
  • Ryan Howard, Phillies
  • Joey Votto, Reds
Second Basemen
  • Brandon Phillips, Reds
  • Dan Uggla, Braves
  • Neil Walker, Pirates*
Third Basemen
  • Chipper Jones, Braves
  • Aramis Ramirez, Cubs
  • Pablo Sandoval, Giants
Shortstops
  • Starlin Castro, Cubs*
  • Jose Reyes, Mets
  • Troy Tulowitzki, Rockies
Outfielders
  • Lance Berkman, Cardinals
  • Ryan Braun, Brewers
  • Jay Bruce, Reds*
  • Carlos Gonzalez, Rockies
  • Matt Kemp, Dodgers
  • Carlos Lee, Astros
  • Andrew McCutchen, Pirates
  • Hunter Pence, Phillies
  • Mike Stanton, Marlins*
Catchers
  • Brian McCann, Braves
  • Yadier Molina, Cardinals
  • Miguel Montero, Diamondbacks*
Designated Hitter
  • Michael Morse, Nationals*
Pitchers
  • John Axford, Brewers*
  • Heath Bell, Padres
  • Tyler Clippard, Nationals*
  • Yovani Gallardo, Brewers*
  • Zack Greinke, Brewers
  • Roy Halladay, Phillies
  • Ian Kennedy, Diamondbacks*
  • Clayton Kershaw, Dodgers*
  • Craig Kimbrel, Braves*
  • Cliff Lee, Phillies
  • J. J. Putz, Diamondbacks
Manager
  • Ron Roenicke, Brewers

2011 American League All-Star Team


First Basemen
  • Miguel Cabrera, Tigers
  • Adrian Gonzalez, Red Sox
  • Paul Konerko, White Sox
Second Basemen
  • Robinson Cano, Yankees
  • Dustin Pedroia, Red Sox
  • Ben Zobrist, Rays*
Third Basemen
  • Adrian Beltre, Rangers
  • Evan Longoria, Rays
  • Mark Reynolds, Orioles
Shortstops
  • Elvis Andrus, Rangers*
  • Asdrubal Cabrera, Indians*
  • Jhonny Peralta, Tigers
Outfielders
  • Jose Bautista, Blue Jays
  • Michael Cuddyer, Twins*
  • Jacoby Ellsbury, Red Sox*
  • Alex Gordon, Royals*
  • Curtis Granderson, Yankees*
  • Josh Hamilton, Rangers
  • Torii Hunter, Angels
  • Adam Jones, Orioles*
  • Josh Willingham, Athletics*
Catchers
  • Alex Avila, Tigers*
  • Mike Napoli, Rangers*
  • Carlos Santana, Indians*
Designated Hitter
  • Michael Young, Rangers
Pitchers
  • Neftali Feliz, Rangers
  • Gio Gonzalez, Athletics*
  • Brandon League, Mariners*
  • Mariano Rivera, Yankees
  • David Robertson, Yankees*
  • CC Sabathia, Yankees
  • James Shields, Rays*
  • Jose Valverde, Tigers
  • Justin Verlander, Tigers
  • Jered Weaver, Angels*
  • C. J. Wilson, Rangers*
Manager
  • John Farrell, Blue Jays

2010 National League All-Star Team


First Basemen
  • Aubrey Huff, Giants
  • Albert Pujols, Cardinals
  • Joey Votto, Reds*
Second Basemen
  • Martin Prado, Braves*
  • Dan Uggla, Marlins
  • Rickie Weeks, Brewers*
Third Basemen
  • Casey McGehee, Brewers*
  • David Wright, Mets
  • Ryan Zimmerman, Nationals
Shortstops
  • Stephen Drew, Diamondbacks*
  • Hanley Ramirez, Marlins
  • Troy Tulowitzki, Rockies
Outfielders
  • Ryan Braun, Brewers
  • Andre Ethier, Dodgers*
  • Carlos Gonzalez, Rockies*
  • Corey Hart, Brewers*
  • Matt Holliday, Cardinals
  • Andrew McCutchen, Pirates*
  • Hunter Pence, Astros*
  • Justin Upton, Diamondbacks
  • Jayson Werth, Phillies
Catchers
  • Brian McCann, Braves
  • Yadier Molina, Cardinals
  • Buster Posey, Giants*
Designated Hitter
  • Adrian Gonzalez, Padres
Pitchers
  • Mike Adams, Padres*
  • Heath Bell, Padres
  • Roy Halladay, Phillies
  • Tim Hudson, Braves
  • Ubaldo Jimenez, Rockies
  • Josh Johnson, Marlins
  • Tim Lincecum, Giants
  • Carlos Marmol, Cubs
  • Billy Wagner, Braves
  • Adam Wainwright, Cardinals
  • Brian Wilson, Giants
Manager
  • Bud Black, Padres

2010 American League All-Star Team


First Basemen
  • Miguel Cabrera, Tigers
  • Paul Konerko, White Sox
  • Mark Teixeira, Yankees
Second Basemen
  • Robinson Cano, Yankees
  • Chone Figgins, Mariners
  • Howie Kendrick, Angels*
Third Basemen
  • Adrian Beltre, Red Sox
  • Evan Longoria, Rays
  • Alex Rodriguez, Yankees
Shortstops
  • Derek Jeter, Yankees
  • Alexei Ramirez, White Sox*
  • Marco Scutaro, Red Sox
Outfielders
  • Jose Bautista, Blue Jays*
  • Shin-Soo Choo, Indians
  • Carl Crawford, Rays
  • Josh Hamilton, Rangers
  • Torii Hunter, Angels
  • Nick Markakis, Orioles
  • Juan Pierre, White Sox
  • Ichiro Suzuki, Mariners
  • Delmon Young, Twins*
Catchers
  • John Buck, Blue Jays*
  • Victor Martinez, Red Sox
  • Joe Mauer, Twins
Designated Hitter
  • Vladimir Guerrero, Rangers
Pitchers
  • Daniel Bard, Red Sox*
  • Trevor Cahill, Athletics*
  • Neftali Feliz, Rangers*
  • Felix Hernandez, Mariners
  • Jon Lester, Red Sox*
  • David Price, Rays*
  • Mariano Rivera, Yankees
  • CC Sabathia, Yankees
  • Joakim Soria, Royals
  • Rafael Soriano, Rays*
  • Justin Verlander, Tigers
Manager
  • Joe Girardi, Yankees

2009 National League All-Star Team


First Basemen
  • Ryan Howard, Phillies
  • Derrek Lee, Cubs
  • Albert Pujols, Cardinals
Second Basemen
  • Luis Castillo, Mets
  • Brandon Phillips, Reds
  • Chase Utley, Phillies
Third Basemen
  • Andy Laroche, Pirates*
  • Mark Reynolds, Diamondbacks*
  • Ryan Zimmerman, Nationals*
Shortstops
  • Hanley Ramirez, Marlins
  • Miguel Tejada, Astros
  • Troy Tulowitzki, Rockies*
Outfielders
  • Ryan Braun, Brewers
  • Adam Dunn, Nationals
  • Brad Hawpe, Rockies
  • Raul Ibañez, Phillies
  • Matt Kemp, Dodgers*
  • Carlos Lee, Astros
  • Justin Upton, Diamondbacks*
  • Shane Victorino, Phillies*
  • Jayson Werth, Phillies*
Catchers
  • Brian McCann, Braves
  • Bengie Molina, Giants
  • Yadier Molina, Cardinals*
Designated Hitter
  • Pablo Sandoval, Giants*
Pitchers
  • Jeremy Affeldt, Giants*
  • Heath Bell, Padres
  • Jonathan Broxton, Dodgers*
  • Chris Carpenter, Cardinals
  • Francisco Cordero, Reds
  • Ryan Franklin, Cardinals*
  • Ubaldo Jimenez, Rockies*
  • Josh Johnson, Marlins*
  • Tim Lincecum, Giants
  • Javier Vasquez, Braves*
  • Adam Wainwright, Cardinals*
Manager
  • Fredi Gonzalez, Marlins

2009 American League All-Star Team


First Basemen
  • Miguel Cabrera, Tigers
  • Carlos Peña, Rays
  • Mark Teixeira, Yankees
Second Basemen
  • Robinson Cano, Yankees
  • Dustin Pedroia, Red Sox
  • Aaron Hill, Blue Jays*
Third Basemen
  • Chone Figgins, Angels*
  • Evan Longoria, Rays
  • Michael Young, Rangers
Shortstops
  • Jason Bartlett, Rays*
  • Derek Jeter, Yankees
  • Marco Scutaro, Blue Jays*
Outfielders
  • Bobby Abreu, Angels
  • Jason Bay, Red Sox
  • Shin-Soo Choo, Indians*
  • Carl Crawford, Rays
  • Nelson Cruz, Rangers*
  • Jack Cust, Athletics
  • Nick Markakis, Orioles
  • Magglio Ordoñez, Tigers
  • Ichiro Suzuki, Mariners
Catchers
  • Victor Martinez, Red Sox
  • Joe Mauer, Twins
  • A. J. Pierzynski, White Sox
Designated Hitter
  • Adam Lind, Blue Jays*
Pitchers
  • Josh Beckett, Red Sox
  • Brian Fuentes, Angels*
  • Zack Grienke, Royals*
  • Matt Guerrier, Twins*
  • Roy Halladay, Blue Jays
  • Felix Hernandez, Mariners*
  • Joe Nathan, Twins
  • Jonathan Papelbon, Red Sox
  • Mariano Rivera, Yankees
  • CC Sabathia, Yankees
  • Justin Verlander, Tigers
Manager
  • Ron Washington, Rangers

Friday, July 6, 2012

2008 National League All-Star Team


First Basemen
  • Lance Berkman, Astros
  • Adrian Gonzalez, Padres*
  • Ryan Howard, Phillies
Second Basemen
  • Mark DeRosa, Cubs*
  • Dan Uggla, Phillies
  • Chase Utley, Phillies
Third Basemen
  • Chipper Jones, Braves
  • Aramis Ramirez, Cubs
  • David Wright, Mets
Shortstops
  • Cristian Guzman, Nationals*
  • Hanley Ramirez, Marlins
  • Jose Reyes, Mets
Outfielders
  • Carlos Beltran, Mets
  • Ryan Braun, Brewers*
  • Pat Burrell, Phillies*
  • Adam Dunn, Diamondbacks
  • Matt Holliday, Rockies
  • Carlos Lee, Astros
  • Ryan Ludwick, Cardinals*
  • Nate McLouth, Pirates*
  • Alfonso Soriano, Cubs
Catchers
  • Russell Martin, Dodgers
  • Bengie Molina, Giants
  • Geovany Soto, Cubs*
Designated Hitter
  • Albert Pujols, Cardinals
Pitchers
  • Chad Billingsley, Dodgers*
  • Ryan Dempster, Cubs*
  • Brad Lidge, Phillies
  • Tim Lincecum, Giants*
  • Carlos Marmol, Cubs*
  • Johan Santana, Mets
  • Jose Valverde, Astros
  • Edinson Volquez, Reds*
  • Brandon Webb, Diamondbacks
  • Brian Wilson, Giants*
  • Kerry Wood, Cubs
Manager
  • Cecil Cooper, Astros