Showing posts with label season in review. Show all posts

Thursday, September 20, 2012

National League Western Conference Season in Review

The results are in and today, we will review the seasons of the twelve All-Star Teams that comprised of the National League Western Conference.

The twelve teams that make up this conference were split into two divisions (click on the links to see the cards and players of each of the teams):
  • Western Conference Division 1 (AL Stadiums)
  1. 1987 (Oakland)
  2. 1989 (Anaheim)
  3. 1995 (Texas)
  4. 2001 (Seattle)
  5. 2003 (Chicago A)
  6. 2010 (Anaheim)
  • Western Conference Division 2 (NL Stadiums)
  1. 1990 (Chicago N)
  2. 1992 (San Diego)
  3. 1998 (Colorado)
  4. 2004 (Houston)
  5. 2007 (San Francisco)
  6. 2009 (St. Louis)
Here are the results of the simulated 162-game season:


If you can't see the picture, here are the standings:

Western Conference Division 1
  • 03 NL ALL-STAR 101-61
  • 01 NL ALL-STAR 94-68
  • 10 NL ALL-STAR 84-78
  • 95 NL ALL-STAR 78-84
  • 87 NL ALL-STAR 70-92
  • 89 NL ALL-STAR 62-100

2003 NL All-Stars - NL Western Conference Division 1 Winner

Western Conference Division 2
  • 98 NL ALL-STAR 93-69
  • 07 NL ALL-STAR 86-76
  • 92 NL ALL-STAR 83-79
  • 09 NL ALL-STAR 82-80
  • 04 NL ALL-STAR 79-83
  • 90 NL ALL-STAR 60-102

1998 NL All-Stars - NL Western Conference Division 2 Winner

Some of the season highlights:

Teammates Rich Aurelia and Chipper Jones (2001 NL) both hit for the cycle (Aurelia against the 2007 NL All-Stars; Jones against the 1992 NL All-Stars).


Team stats:

The 1998 NL All-Stars led the NL West Conference in batting average (.283), RBI's (862, Devon White with 72), and OPS (.812). The 2001 NL All-Stars led in home runs (233, Barry Bonds with 28), while the 1992 team led in stolen bases (194, Marquis Grissom with 40).

The 2003 NL All-Stars won the conference regular season title with its 101-61 record. The team also led the Conference in saves with 52. The 2010 NL All-Stars team led in team ERA with a "low" 3.49. The 2001 NL All-Stars and 2004 NL All-Stars shared the conference lead in complete games with 22 each, while the 2001 NL All-Stars and 2007 NL All-Stars tied for most shutouts with 9 a piece.

The 1992 NL All-Stars led the conference in fielding percentage (a low 75 errors, .988 fielding percentage).

The top four teams in each division will advance to the 32-team tournament, meaning eight teams will advance to the postseason. Each round of this postseason will consist of 10,000 simulated games, and each series will have it's own post (akin to the simulations I held on my humble, little blog). Each first place team will take on the fourth place team within its division, and each second place team will take on the third place team. So the first eight series will consist of the following teams:

Western Conference Division 1
(1) 2003 NL vs. (4) 1995 NL
(2) 2001 NL vs. (3) 2010 NL

Western Conference Division 2
(1) 1998 NL vs. (4) 2009 NL
(2) 2007 NL vs. (3) 1992 NL

Congratulations to the advancing teams. On Friday, the final tournament bracket with all 32 playoff-bound teams will be up, as well as a quick tournament for the 16 teams for the eliminated teams.

Sincerely,

JayBee Anama

Wednesday, September 19, 2012

National League Eastern Conference Season in Review

The results are in and today, we will review the seasons of the twelve All-Star Teams that comprised of the National League Eastern Conference.

The twelve teams that make up this conference were split into two divisions (click on the links to see the cards and players of each of the teams):
  • Eastern Conference Division 1 (AL Stadiums)
  1. 1991 (Toronto)
  2. 1993 (Baltimore)
  3. 1997 (Cleveland)
  4. 1999 (Boston)
  5. 2005 (Detroit)
  6. 2008 (New York A)
  • Eastern Conference Division 2 (NL Stadiums)
  1. 1988 (Cincinnati)
  2. 1994 (Pittsburgh)
  3. 1996 (Philadelphia)
  4. 2000 (Atlanta)
  5. 2002 (Milwaukee)
  6. 2006 (Pittsburgh)
Here are the results of the simulated 162-game season:


If you can't see the picture, here are the standings:

Eastern Conference Division 1
  • 99 NL ALL-STAR 98-64
  • 05 NL ALL-STAR 91-71
  • 08 NL ALL-STAR 84-78
  • 97 NL ALL-STAR 83-79
  • 93 NL ALL-STAR 76-86
  • 91 NL ALL-STAR 56-106

1999 NL All-Stars - NL Eastern Conference Division 1 Winner 


Eastern Conference Division 2
  • 02 NL ALL-STAR 97-65
  • 00 NL ALL-STAR 92-70
  • 96 NL ALL-STAR 85-77
  • 06 NL ALL-STAR 81-81
  • 94 NL ALL-STAR 67-95
  • 88 NL ALL-STAR 62-100

2002 NL All-Stars - NL Eastern Conference Division 2 Winner 

Team stats:

The 1999 NL All-Stars led the NL East Conference in batting average (.277), home runs (250, Mark McGwire with 30) RBI's (845, McGwire with 69), OPS (.818). The 1988 team led in stolen bases (168, Andy Van Slyke with 24).

The 1999 NL All-Stars, led by Kevin Millwood (19-7, 3.32 ERA), won the conference regular season title with its 98-64 record (which coincidentally, the 1999 AL All-Stars finished their season with the same record). The 2002 and 2008 NL All-Stars teams tied for the conference lead in saves with 51. The 1997 team led in team ERA with a "low" 3.78 and shutouts with 10. The 1991 NL All-Stars led the conference with 32 complete games.

The 2008 NL All-Stars led the conference in fielding percentage (a low 86 errors, .986 fielding percentage).

The top four teams in each division will advance to the 32-team tournament, meaning eight teams will advance to the postseason. Each round of this postseason will consist of 10,000 simulated games, and each series will have it's own post (akin to the simulations I held on my humble, little blog). Each first place team will take on the fourth place team within its division, and each second place team will take on the third place team. So the first eight series will consist of the following teams:

Eastern Conference Division 1
(1) 1999 NL vs. (4) 1997 NL
(2) 2005 NL vs. (3) 2008 NL

Eastern Conference Division 2
(1) 2002 NL vs. (4) 2006 NL
(2) 2000 NL vs. (3) 1996 NL

Congratulations to the advancing teams. On Thursday, the National League Western Conference season in review.

Sincerely,

JayBee Anama

Tuesday, September 18, 2012

American League Western Conference Season in Review

The results are in and today, we will review the seasons of the twelve All-Star Teams that comprised of the American League Western Conference.

The twelve teams that make up this conference were split into two divisions (click on the links to see the cards and players of each of the teams):
  • Western Conference Division 1 (AL Stadiums)
  1. 1987 (Oakland)
  2. 1989 (Anaheim)
  3. 1995 (Texas)
  4. 2001 (Seattle)
  5. 2003 (Chicago A)
  6. 2010 (Anaheim)
  • Western Conference Division 2 (NL Stadiums)
  1. 1990 (Chicago N)
  2. 1992 (San Diego)
  3. 1998 (Colorado)
  4. 2004 (Houston)
  5. 2007 (San Francisco)
  6. 2009 (St. Louis)
Here are the results of the simulated 162-game season:


If you can't see the picture, here are the standings:

Western Conference Division 1
  • 03 AL ALL-STAR 99-63
  • 95 AL ALL-STAR 95-67
  • 01 AL ALL-STAR 87-75
  • 10 AL ALL-STAR 87-75
  • 87 AL ALL-STAR 72-90
  • 89 AL ALL-STAR 70-92

2003 AL All-Stars - AL Western Conference Division 1 Winner 

Western Conference Division 2
  • 09 AL ALL-STAR 86-76
  • 98 AL ALL-STAR 85-77
  • 04 AL ALL-STAR 83-79
  • 07 AL ALL-STAR 80-82
  • 90 AL ALL-STAR 68-94
  • 92 AL ALL-STAR 60-102

2009 AL All-Stars - AL Western Conference Division 2 Winner 

The 2001 and 2010 AL All-Star Teams shared the same 87-75 record, third best in Division 1. However, both teams split the 18 games they played against each other (with each team going 6-3 on the road).  So, to determine who gets the higher seeding, the number of wins against the rest of the division were researched.  After reviewing the game logs of the 144 games the two teams played against the other four teams in their division, it looks like the 2001 All-Stars went 39-33 against the rest of the division, which beats the 35-37 divisional record of the 2010 team.

Team stats:

The 1995 AL All-Stars led the AL Western Conference in batting average (.281), RBI's (900, Albert Belle with 145), OPS (.817). The 2001 AL All-Stars led in home runs (241, Mike Sweeney with 20), while the 2009 team led in stolen bases (158, Carl Crawford with 36).

The 2003 AL All-Stars won the conference regular season title with its 99-63 record. The team also led the Conference in saves with 58. The 2010 AL All-Stars team led in team ERA with a "low" 3.71. The 1987 AL All-Stars led the conference with an astounding 86 complete games while the 1995 team led in shutouts with 12 shutouts.

The 1998 AL All-Stars led the conference in fielding percentage (a low 84 errors, .986 fielding percentage).

The top four teams in each division will advance to the 32-team tournament, meaning eight teams will advance to the postseason. Each round of this postseason will consist of 10,000 simulated games, and each series will have it's own post (akin to the simulations I held on my humble, little blog). Each first place team will take on the fourth place team within its division, and each second place team will take on the third place team. So the first eight series will consist of the following teams:

Western Conference Division 1
(1) 2003 AL vs. (4) 2010 AL
(2) 1995 AL vs. (3) 2001 AL

Western Conference Division 2
(1) 2009 AL vs. (4) 2007 AL
(2) 1998 AL vs. (3) 2004 AL

Congratulations to the advancing teams. On Wednesday, the National League Eastern Conference season in review.

Sincerely,

JayBee Anama

Monday, September 17, 2012

American League Eastern Conference Season in Review

The results are in and today, we will review the seasons of the twelve All-Star Teams that comprised of the American League Eastern Conference.

The twelve teams that make up this conference were split into two divisions (click on the links to see the cards and players of each of the teams):
  • Eastern Conference Division 1 (AL Stadiums)
  1. 1991 (Toronto)
  2. 1993 (Baltimore)
  3. 1997 (Cleveland)
  4. 1999 (Boston)
  5. 2005 (Detroit)
  6. 2008 (New York A)
  • Eastern Conference Division 2 (NL Stadiums)
  1. 1988 (Cincinnati)
  2. 1994 (Pittsburgh)
  3. 1996 (Philadelphia)
  4. 2000 (Atlanta)
  5. 2002 (Milwaukee)
  6. 2006 (Pittsburgh)
Here are the results of the simulated 162-game season:


If you can't see the picture, here are the standings:

Eastern Conference Division 1
  • 99 AL ALL-STAR 98-64
  • 97 AL ALL-STAR 91-71
  • 08 AL ALL-STAR 75-87
  • 93 AL ALL-STAR 72-90
  • 05 AL ALL-STAR 72-90
  • 91 AL ALL-STAR 70-92

1999 AL All-Stars - AL Eastern Conference Division 1 Winner

Eastern Conference Division 2
  • 94 AL ALL-STAR 93-69
  • 06 AL ALL-STAR 88-74
  • 00 AL ALL-STAR 84-78
  • 02 AL ALL-STAR 81-81
  • 96 AL ALL-STAR 77-85
  • 88 AL ALL-STAR 71-91

1994 AL All-Stars - AL Eastern Conference Division 2 Winner

The 1993 and 2005 AL All-Star Teams shared the same 72-90 record, fourth best in Division 1. However, after reviewing the game logs of the 18 games these two teams played head-to-head, the 1993 team won the season series over the 2005 team 10 games to 8.

Some of the season highlights:

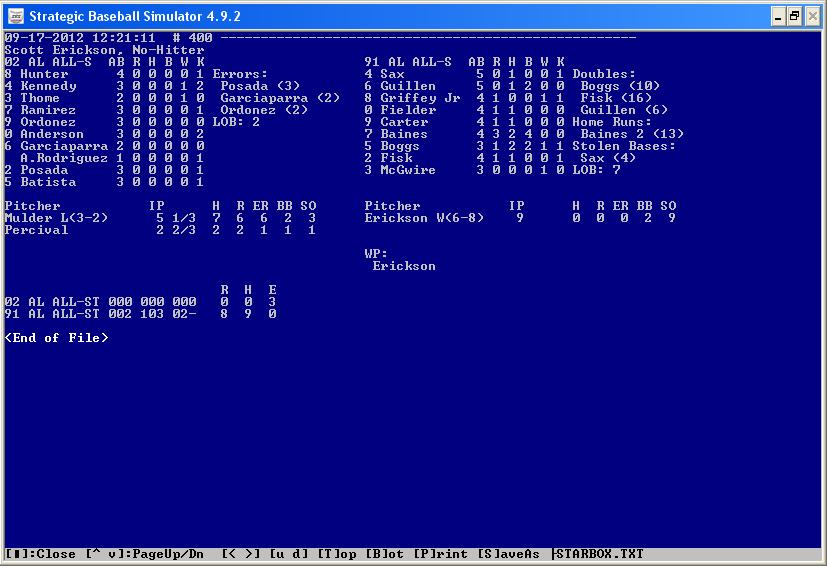
Scott Erickson (1991 AL) pitching a no-hitter against the 2002 AL All-Star Team (9 strikeouts, 2 walks).


Team stats:

The 1999 AL All-Stars led the AL East Conference in batting average (.283), RBI's (868, Ken Griffey, Jr. with 67), and OPS (.806). The 2000 AL All-Stars led in home runs (229, Tony Batista with 24), while the 1991 team led in stolen bases (138, Roberto Alomar with 31).

The 1999 AL All-Stars, led by Pedro Martinez (21-2, 2.11 ERA), won the conference regular season title with its 98-64 record. The 1997 AL All-Stars led the Conference in saves with 51. The team also led in team ERA with a "low" 3.82. The 1994 AL All-Stars led the conference with 50 complete games and 10 shutouts.

The 1991 AL All-Stars led the conference in fielding percentage (a low 91 errors, .985 fielding percentage).

The top four teams in each division will advance to the 32-team tournament, meaning eight teams will advance to the postseason. Each round of this postseason will consist of 10,000 simulated games, and each series will have it's own post (akin to the simulations I held on my humble, little blog). Each first place team will take on the fourth place team within its division, and each second place team will take on the third place team. So the first eight series will consist of the following teams:

Eastern Conference Division 1
(1) 1999 AL vs. (4) 1993 AL
(2) 1997 AL vs. (3) 2008 AL

Eastern Conference Division 2
(1) 1994 AL vs. (4) 2002 AL
(2) 2006 AL vs. (3) 2000 AL

Congratulations to the advancing teams. On Tuesday, the American League Western Conference season in review.

Sincerely,

JayBee Anama