The twelve teams that make up this conference were split into two divisions (click on the links to see the cards and players of each of the teams):
- Eastern Conference Division 1 (AL Stadiums)
- Eastern Conference Division 2 (NL Stadiums)
- 1988 (Cincinnati)
- 1994 (Pittsburgh)
- 1996 (Philadelphia)
- 2000 (Atlanta)
- 2002 (Milwaukee)
- 2006 (Pittsburgh)

If you can't see the picture, here are the standings:
Eastern Conference Division 1
- 99 AL ALL-STAR 98-64
- 97 AL ALL-STAR 91-71
- 08 AL ALL-STAR 75-87
- 93 AL ALL-STAR 72-90
- 05 AL ALL-STAR 72-90
- 91 AL ALL-STAR 70-92
 |
| 1999 AL All-Stars - AL Eastern Conference Division 1 Winner |
Eastern Conference Division 2
- 94 AL ALL-STAR 93-69
- 06 AL ALL-STAR 88-74
- 00 AL ALL-STAR 84-78
- 02 AL ALL-STAR 81-81
- 96 AL ALL-STAR 77-85
- 88 AL ALL-STAR 71-91
 |
| 1994 AL All-Stars - AL Eastern Conference Division 2 Winner |
The 1993 and 2005 AL All-Star Teams shared the same 72-90 record, fourth best in Division 1. However, after reviewing the game logs of the 18 games these two teams played head-to-head, the 1993 team won the season series over the 2005 team 10 games to 8.
Some of the season highlights:
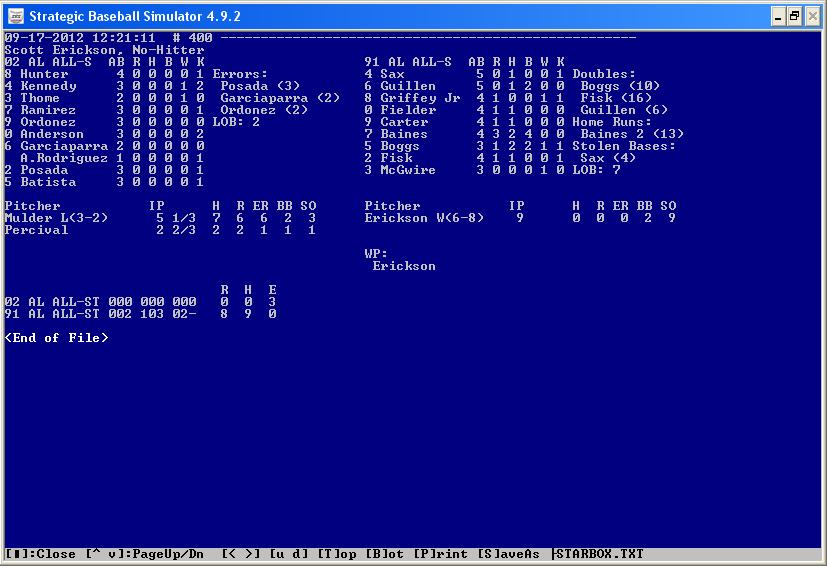
Scott Erickson (1991 AL) pitching a no-hitter against the 2002 AL All-Star Team (9 strikeouts, 2 walks).
Team stats:
The 1999 AL All-Stars led the AL East Conference in batting average (.283), RBI's (868, Ken Griffey, Jr. with 67), and OPS (.806). The 2000 AL All-Stars led in home runs (229, Tony Batista with 24), while the 1991 team led in stolen bases (138, Roberto Alomar with 31).
The 1999 AL All-Stars, led by Pedro Martinez (21-2, 2.11 ERA), won the conference regular season title with its 98-64 record. The 1997 AL All-Stars led the Conference in saves with 51. The team also led in team ERA with a "low" 3.82. The 1994 AL All-Stars led the conference with 50 complete games and 10 shutouts.
The 1991 AL All-Stars led the conference in fielding percentage (a low 91 errors, .985 fielding percentage).
The top four teams in each division will advance to the 32-team tournament, meaning eight teams will advance to the postseason. Each round of this postseason will consist of 10,000 simulated games, and each series will have it's own post (akin to the simulations I held on my humble, little blog). Each first place team will take on the fourth place team within its division, and each second place team will take on the third place team. So the first eight series will consist of the following teams:
Eastern Conference Division 1
(1) 1999 AL vs. (4) 1993 AL
(2) 1997 AL vs. (3) 2008 AL
Eastern Conference Division 2
(1) 1994 AL vs. (4) 2002 AL
(2) 2006 AL vs. (3) 2000 AL
Congratulations to the advancing teams. On Tuesday, the American League Western Conference season in review.
Sincerely,
JayBee Anama
No comments:
Post a Comment